How to Analyze a Football Match: Real-Time AI Guide
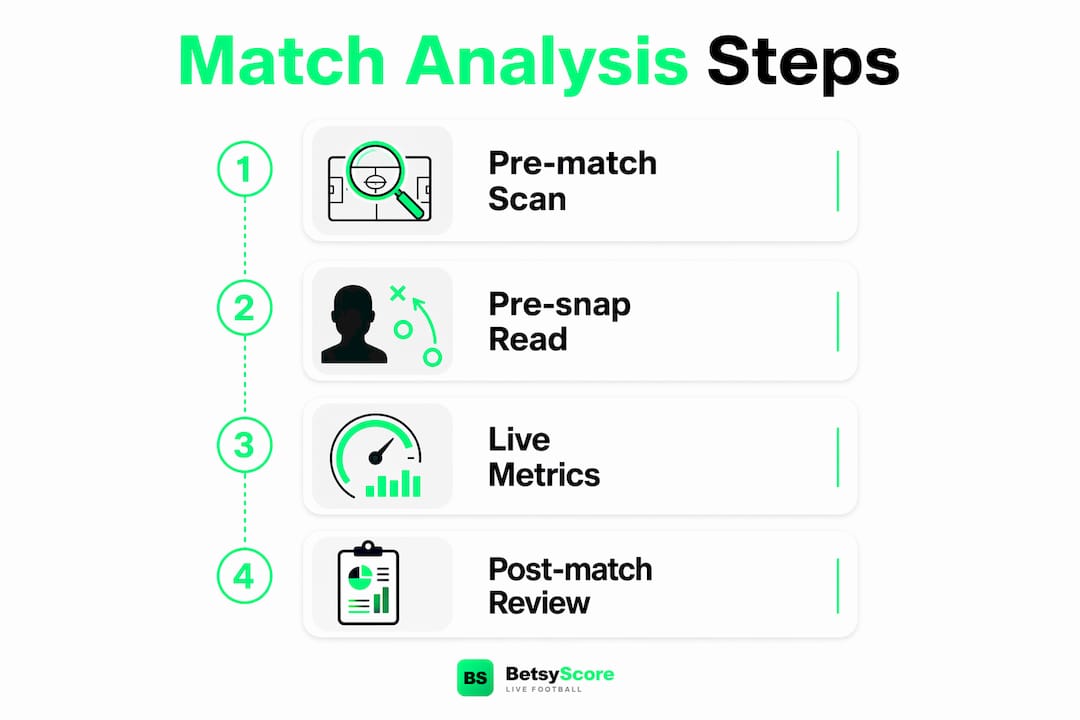
Start with a four-step protocol: a brief pre-match scan, a very quick pre-snap read, regular metric checks every few minutes, and a post-match review lasting under an hour. This sequence applies whether you are watching a Premier League fixture or a local amateur match. The core metrics to track are xG (expected goals), pressing intensity, and AI prediction shifts from Betsyscore. UCFB analysts note that modern football analysis has moved decisively away from intuition toward objective, data-driven practice focused on diagnosing systemic tactical issues, not individual errors.
- Pre-match (5–12 min): Review formation tendencies, key absences, and recent xG trends.
- Pre-snap read (under 4 seconds): Strength side → personnel grouping → key alignment.
- In-play checks (every 3–7 min): Monitor xG swing, pressing intensity, and Betsyscore AI prediction shifts.
- Post-match review (30–60 min): Tag footage, grade assignments, and identify patterns exceeding an 80% occurrence threshold.
Table of Contents
- How to analyze a football match before kickoff
- Which live metrics should you watch during a match?
- What does a post-match tactical checklist look like?
- What tools and data sources can U.S. fans use?
- How do you turn analysis into coach-ready communication?
- How do you validate reads and avoid false confidence?
- Key Takeaways
- Why this protocol works for fans, not just professionals
- Betsyscore gives you live AI signals during every match
- Useful sources
- FAQ
How to analyze a football match before kickoff
Effective pre-match preparation takes a short time and produces two to three specific watch-questions that guide everything you observe during the match. Start with the opponent’s formation tendencies: which shape do they default to, and does it shift by game state? Cross-reference that with recent xG trends to identify whether their attacking output is sustainable or inflated by low-probability shots. Note key absences, because a missing holding midfielder or first-choice center back changes both line height and set-piece vulnerability.
The under-4-second pre-snap sequence runs: identify the strength side, count personnel groupings, then locate the conflict key (the defender or space most likely to be attacked). Personnel grouping identification narrows likely play concepts immediately. Practice counting skill players quickly using a multi-play scan drill: pause at lineup, predict the play type, then score yourself. Verbalization speeds the read further.
Pro Tip: Use your pre-match data to write two to three specific, transferable questions — for example, “Does their left back push high when they press?” — rather than general observations. Targeted questions produce transferable coaching points.
A useful pre-match checklist:
- Confirm starting lineups and note positional changes from the previous match.
- Check match previews for formation and set-piece tendencies.
- Review the opponent’s last three xG figures to distinguish genuine attacking threat from variance.
- Identify the likely set-piece delivery target and the defensive shape at restarts.
- Set Betsyscore’s live prediction baseline before kickoff so shifts during the match are immediately meaningful.
Which live metrics should you watch during a match?
Three primary metrics per game is the right ceiling. Performance analysts warn that more metrics do not automatically produce better coaching outcomes; clarity and direct transfer into training are what matter. Use Betsyscore’s AI flags to surface anomalies, then investigate with a second data window.
| Metric | What it measures | Real-time interpretation | Actionable signal |
|---|---|---|---|
| xG (team) | Shot quality and volume | Sudden swing signals a tactical shift | Note the phase that generated it |
| Big Chances | High-probability shots | Two or more in ten minutes indicates a structural gap | Identify which channel is being exploited |
| Pressing intensity (PPDA) | Defensive pressure per defensive action | Rising PPDA means the press is breaking down | Watch for exposed fullbacks on transitions |
| Line height | Defensive depth | High line + low PPDA = through-ball window | Flag for post-match clip review |
| Transitions per minute | Speed of phase changes | Spike after a substitution reveals a tactical adjustment | Cross-reference with Betsyscore prediction shift |
| AI prediction shift | Win-probability change | A shift of five or more percentage points in one minute signals a significant event | Correlate with a specific clip or substitution |
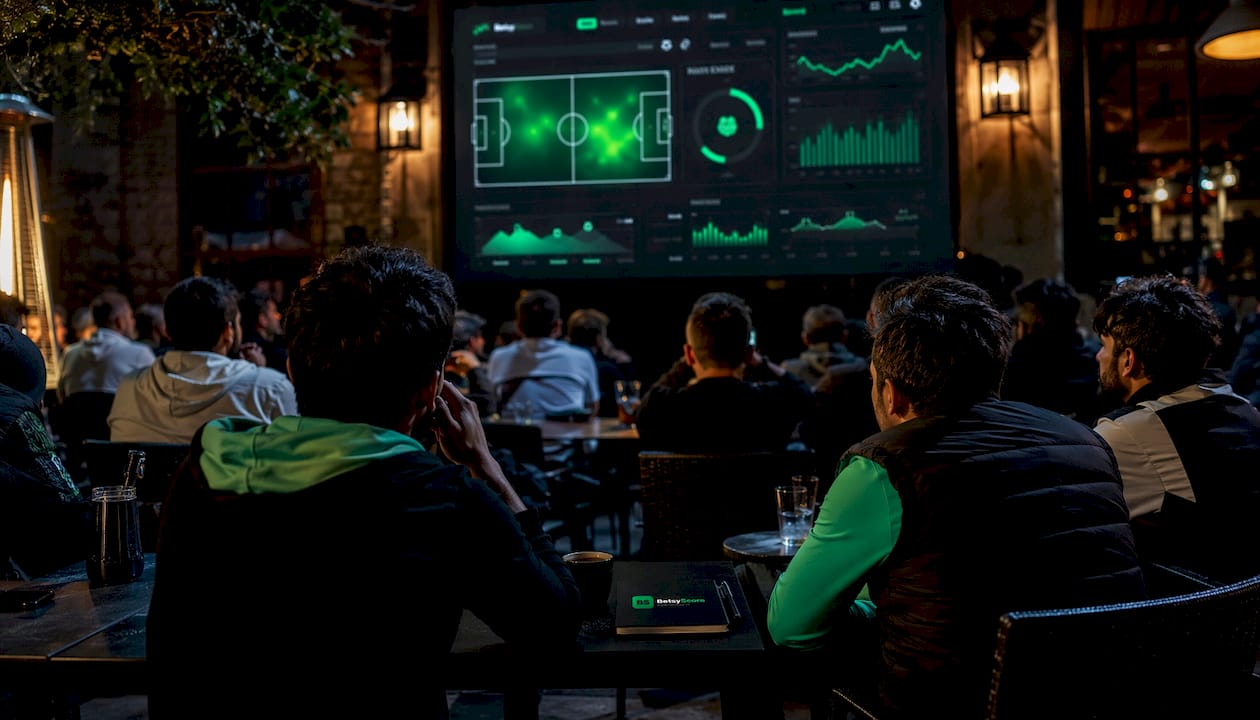
Live scouting adds tempo and sideline behavior that film alone cannot capture. When an opponent raises their defensive line, watch the space behind the last defender for through-ball windows. A sustained intensity drop immediately after a substitution often reveals an exploitable flank before the data confirms it.
Pro Tip: Track xG, pressing intensity, and Betsyscore prediction shifts as your three primary metrics. Use AI flags as the trigger to investigate a fourth metric, not as a reason to expand your tracking list.
What does a post-match tactical checklist look like?
The first 12 hours after a match are the most productive for raw tagging. A structured five-phase film review begins with Phase 1 raw tagging in that window, moving through organization, analysis, and distribution over 48–72 hours. For fans and non-professional analysts, a compressed version works well.
- Tag and organize footage (0–12 hours): Clip by phase: own offense, own defense, transitions, set pieces.
- Grade assignments (+/–/○): Apply a simple rubric to each tagged clip. Positive, negative, or neutral execution.
- Run tendency charts: Map formation to play type and note down-and-distance patterns.
- Flag patterns at ≥80% occurrence: Experts require a strong pattern before implementing automatic tactical adjustments. Below that threshold, you are reacting to noise.
- Derive 3–5 training tasks: Each task addresses a systemic pattern, not an individual error.
Combine Betsyscore AI prediction shifts with film evidence before drawing conclusions. A prediction shift that lacks a corresponding clip is a false positive until corroborated. Review the post-match stats that matter most: xG differential, progressive pass completion, and set-piece delivery accuracy.
Pro Tip: Prioritize problems where video evidence and a consistent data tendency intersect. One without the other is insufficient to justify a training change.
What tools and data sources can U.S. fans use?
The two-window live setup is the practical standard: video feed on one screen, Betsyscore’s live match view on the other. Betsyscore provides AI prediction shifts, live xG, lineups, and minute-by-minute stats across more than 200 competitions, including the FIFA World Cup 2026, Premier League, La Liga, and Champions League.
- Betsyscore: Live AI predictions, momentum reads, instant stats, and lineups. Open during every live match.
- FBref: Seasonal stats and player comparators. Free. Use for pre-match xG trend research.
- Understat: Shot-level xG data by match. Free for most leagues. Use for post-match shot-quality review.
- StatsBomb: Advanced event data with detailed pressure and carry metrics. Subscription required; professional-grade.
- Opta / StatsPerform: Professional event feeds used by broadcasters and clubs. Subscription required; enterprise-level access.
Auto-detection platforms can cut Phase 1 film review time significantly but still require human verification. Betsyscore’s AI flags serve the same function during live matches: they surface the moment worth investigating, but the analyst confirms it with a clip. U.S. fans following amateur or lower-division matches will find Opta and StatsBomb feeds unavailable; FBref and Understat cover most professional leagues accessible in the United States. For fans attending matches in person, understanding fan package options can help plan the right setup for stadium analysis.
How do you turn analysis into coach-ready communication?
The standard for effective communication is specificity: one metric, one clip, one timestamp, one drill recommendation. Sevilla FC treats tactical analysis as a transversal tool connecting coaching staff, scouting, and competitive planning. That integration works because analysts communicate findings clearly rather than accumulating data.
A practical communication template:
- Summary (1–2 sentences): State the pattern and its tactical consequence.
- Supporting metric: Cite the specific figure (e.g., xG conceded from set pieces: 0.8 in two matches).
- Video clip + timestamp: Reference the exact moment that illustrates the pattern.
- Drill recommendation: Propose one training task that addresses the root cause.
Tactical analysis is most effective when it explains why situations occur, not just what happened. Linking data to video to a training task is the complete chain. Without the final link, analysis remains observation.
Avoid jargon overload when sharing insights with teammates or coaches. Prefer watch-questions over declarative conclusions. Timestamp every piece of evidence. Film captures the majority of what you need, but live viewing adds tempo and sideline behavior that video alone misses, which is why the live protocol matters alongside post-match review.
How do you validate reads and avoid false confidence?
Validation requires three conditions: a metric flag, a corresponding clip, and repetition across at least two to three matches. The 80%+ occurrence threshold is the standard before automating any tactical check. Below that, the pattern may be real but not yet reliable enough to build a game plan around.
- Require metric + clip + repetition before any training change.
- Re-check the same tendency across two to three matches before treating it as a persistent tendency.
- Corroborate every Betsyscore AI flag with a film clip before acting on it.
- Avoid confirmation bias: look for evidence that contradicts the pattern, not only evidence that supports it.
- Avoid recency bias: a high-visibility event in the final ten minutes distorts perception of the full match.
A simple validation template: record the prediction change → locate the corresponding clip → measure occurrence over the last 20 events. Twenty events is the recommended sample for a reliable tendency read.
Pro Tip: Set an evidence bar that requires metric + clip + repetition before any training change. A single striking event, however visible, does not meet that bar.
Key Takeaways
Effective football match analysis follows a four-stage protocol: pre-match scan, under-4-second pre-snap read, live metric checks every 3–7 minutes, and a post-match review requiring high pattern occurrence before any tactical adjustment.
| Point | Details |
|---|---|
| Four-stage protocol | Pre-match scan, under-4-second pre-snap read, in-play checks every 3–7 minutes, and 30–60 min post-match review. |
| Limit live metrics to three | Track xG, pressing intensity, and AI prediction shifts; use Betsyscore flags to investigate further. |
| 80% occurrence threshold | Require ≥80% pattern occurrence before implementing automatic tactical adjustments. |
| Pair AI flags with clips | Every Betsyscore prediction shift needs a corresponding video clip before it becomes an actionable finding. |
| Betsyscore for live analysis | Betsyscore provides live xG, AI prediction shifts, lineups, and momentum reads across 200+ competitions. |
Why this protocol works for fans, not just professionals
The gap between professional analysts and engaged fans is narrower than most assume. The protocol described here does not require access to Opta feeds or a full film room. It requires discipline: a pre-match checklist, three tracked metrics, and a post-match review that demands evidence before conclusions. The shift from intuition to data-driven practice that UCFB identifies in professional clubs applies equally at the fan level. Fans who track xG and pressing intensity during a live match and then cross-reference with Betsyscore’s AI prediction history are doing the same analytical work, at a different scale. The risk for non-professional analysts is metric accumulation without translation. Analysis that does not end in a specific training task or a specific watch-question for the next match has not completed its purpose.
Betsyscore gives you live AI signals during every match

Betsyscore puts the full live protocol in one place. Before kickoff, check live lineups and formation data. During the match, the AI predictions page tracks win-probability shifts minute by minute, built from xG, recent form, and head-to-head records. The momentum read shows which side is on top in real time, so you can correlate a pressing intensity drop with an actual prediction shift rather than guessing. Coverage spans the FIFA World Cup 2026, the Premier League, La Liga, Bundesliga, Serie A, Champions League, and more than 200 competitions worldwide. Betsyscore is a tool to inform viewing and analysis; it is not a substitute for coached practice or professional scouting. Open Betsyscore’s live match view alongside your video feed and run the protocol from the first whistle.
Useful sources
- Signal XO: How to Read Football Plays — Use this for pre-snap scan drills and the 4-second read sequence. The 20-play practice exercise is directly applicable.
- Signal XO: Football Game Film Review — The five-phase system structures post-match work from raw tagging through distribution. Reference for timing and workflow.
- UCFB: The Growing Importance of Analysis in Modern Football — Expert perspective on the shift from intuition to data-driven analysis. Supports the systems-over-blame framing.
- AllAccess Coaching: How to Break Down Film — Source for the 80% occurrence threshold and tendency-chart methodology.
- Sports Data Campus: Tactical Analysis in Football — Covers the Sevilla FC integrated approach and the communication-first principle.
- Lrivo: How to Analyze a Football Match Like a Pro Scout — Practical scouting guide with the “watch more, write less” principle for live observation.
- ISSPF: Tactical Analysis in the Modern Game — Caution against metric overload; clarity and actionability over volume.
- Betsyscore Live — Real-time AI predictions, lineups, and minute-by-minute stats for live match analysis.
FAQ
What is the fastest way to start analyzing a match live?
Open Betsyscore’s live view before kickoff, set a baseline win probability, then track xG, pressing intensity, and AI prediction shifts every 3–7 minutes. The under-4-second pre-snap read (strength → personnel → key alignment) orients each phase restart.
How many metrics should you track during a live match?
Three primary metrics per game is the recommended ceiling. Tracking more reduces clarity without improving outcomes, according to performance analysts at ISSPF.
What is the 80% rule in football match analysis?
Require a pattern to occur at least 80% of the time before implementing it as an automatic tactical adjustment. Below that threshold, the tendency may be noise rather than a persistent strategic behavior.
Which free tools can U.S. fans use for match analysis?
FBref provides seasonal stats and player comparators at no cost. Understat offers shot-level xG data for most major leagues. Betsyscore provides live AI predictions, lineups, and instant stats across 200+ competitions.
How long should a post-match review take?
The full post-match review runs 30–60 minutes for fans. Raw tagging should be completed within 12 hours of the final whistle, with pattern analysis and training task derivation following within 48–72 hours for a structured workflow.